Features
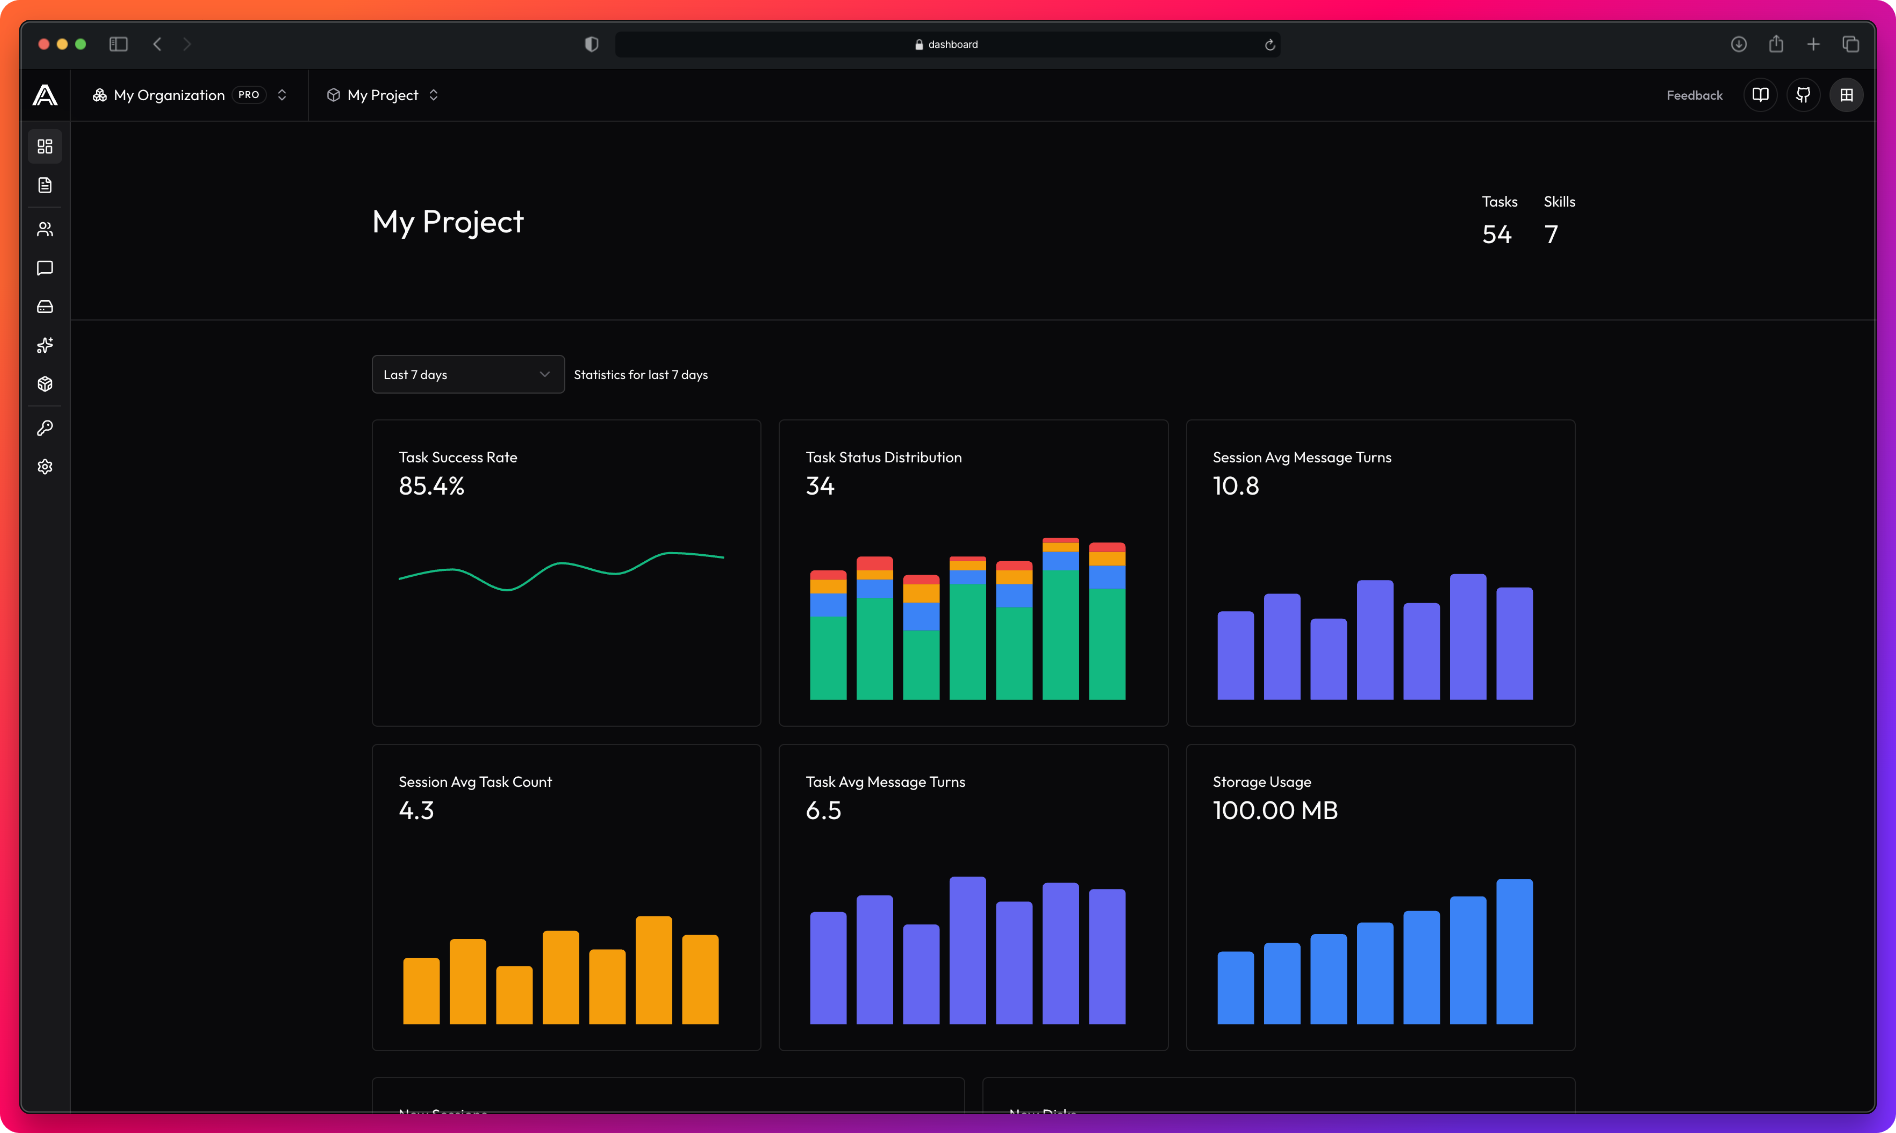
Dashboard
View Context, Artifacts, Tasks and Skills
The dashboard provides visibility into your agent's operations through specialized views.
Metrics
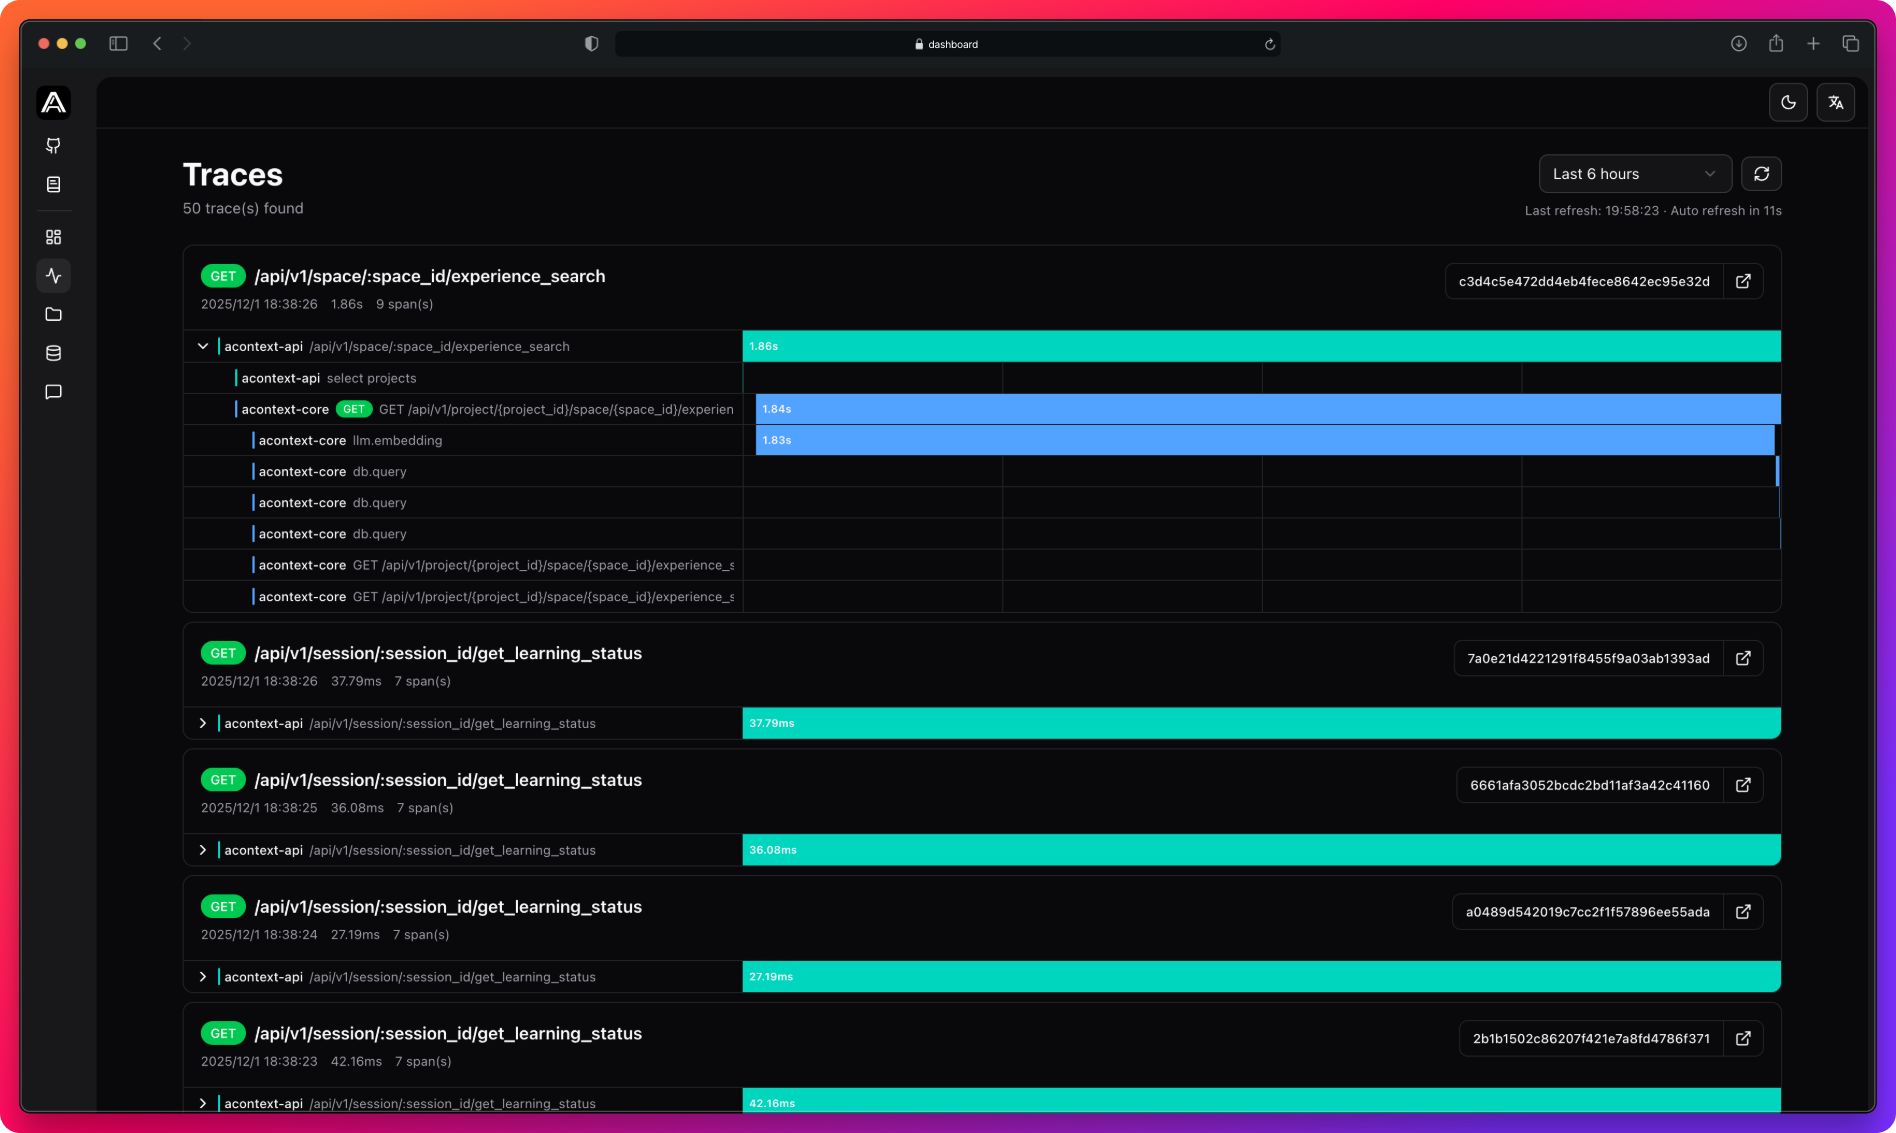
Traces
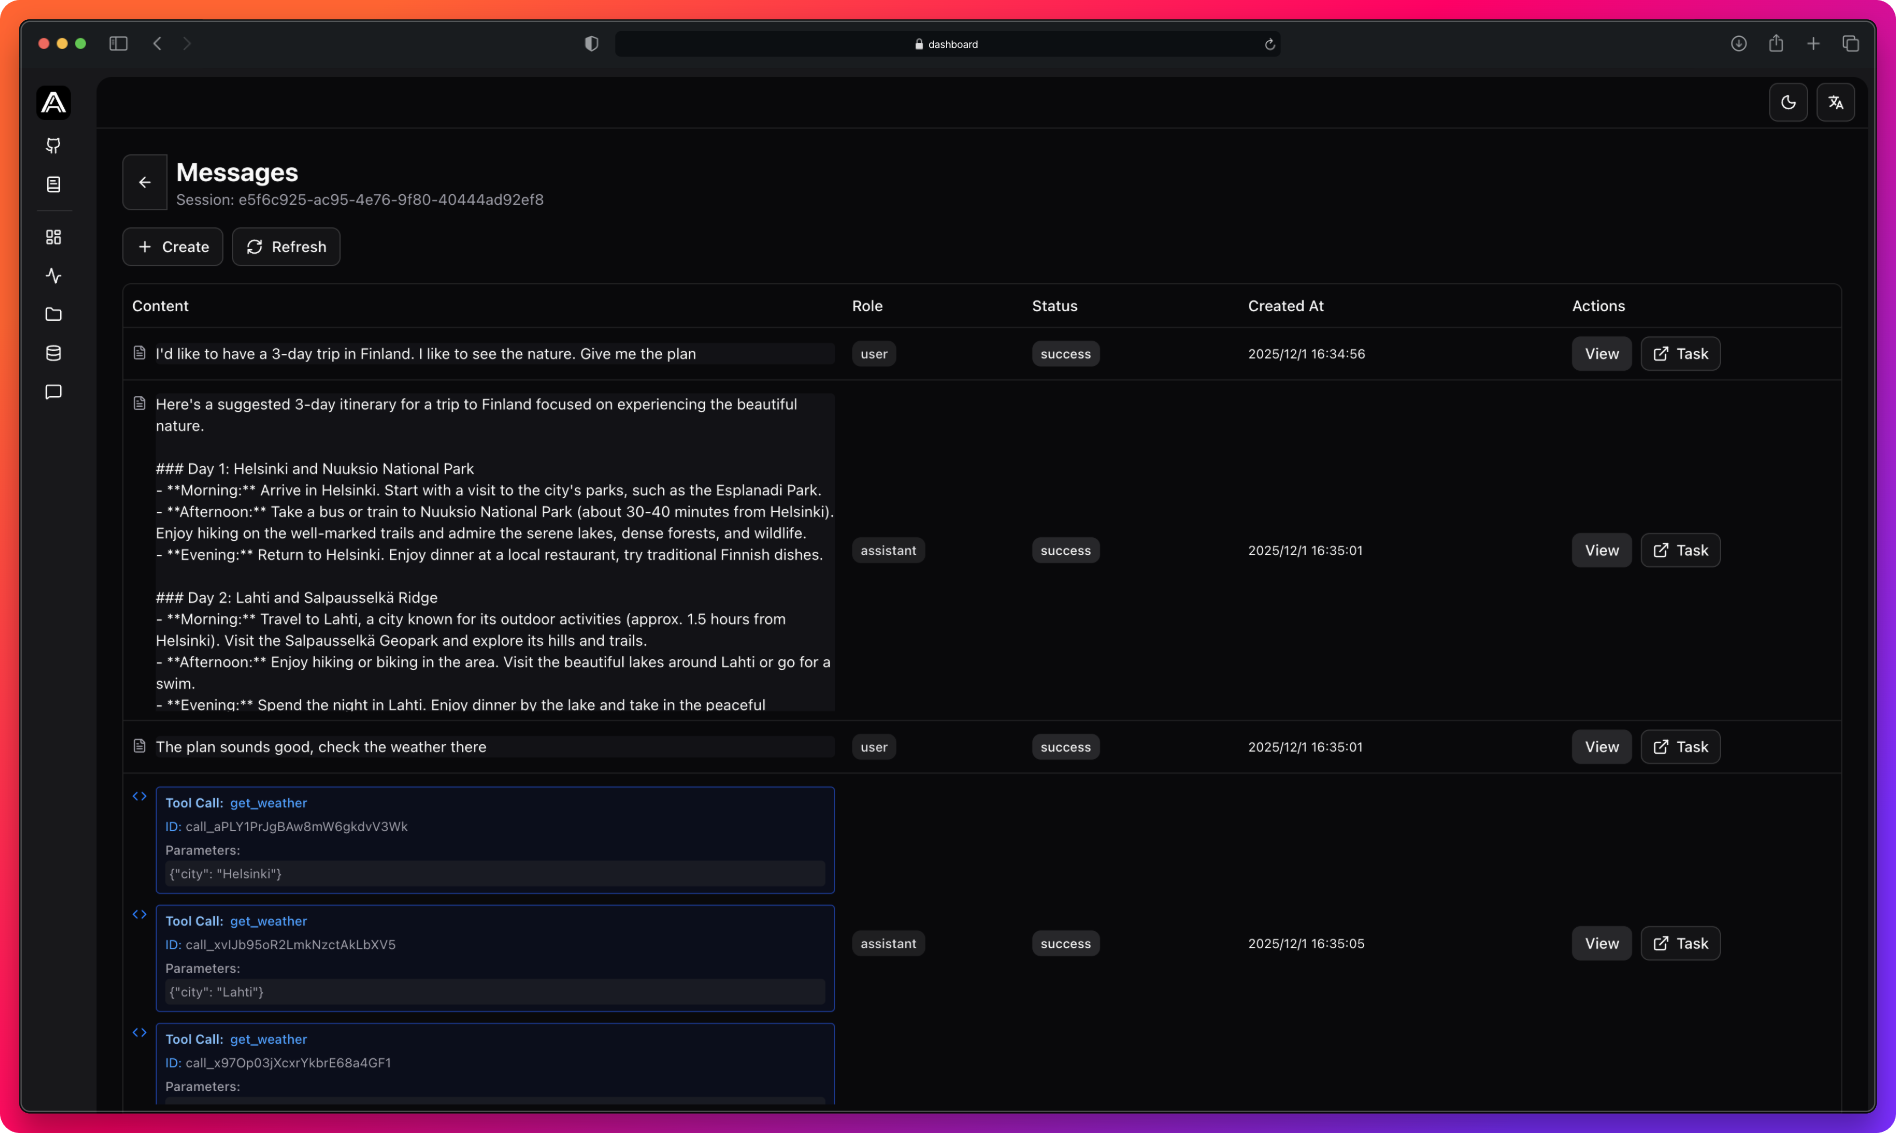
Messages
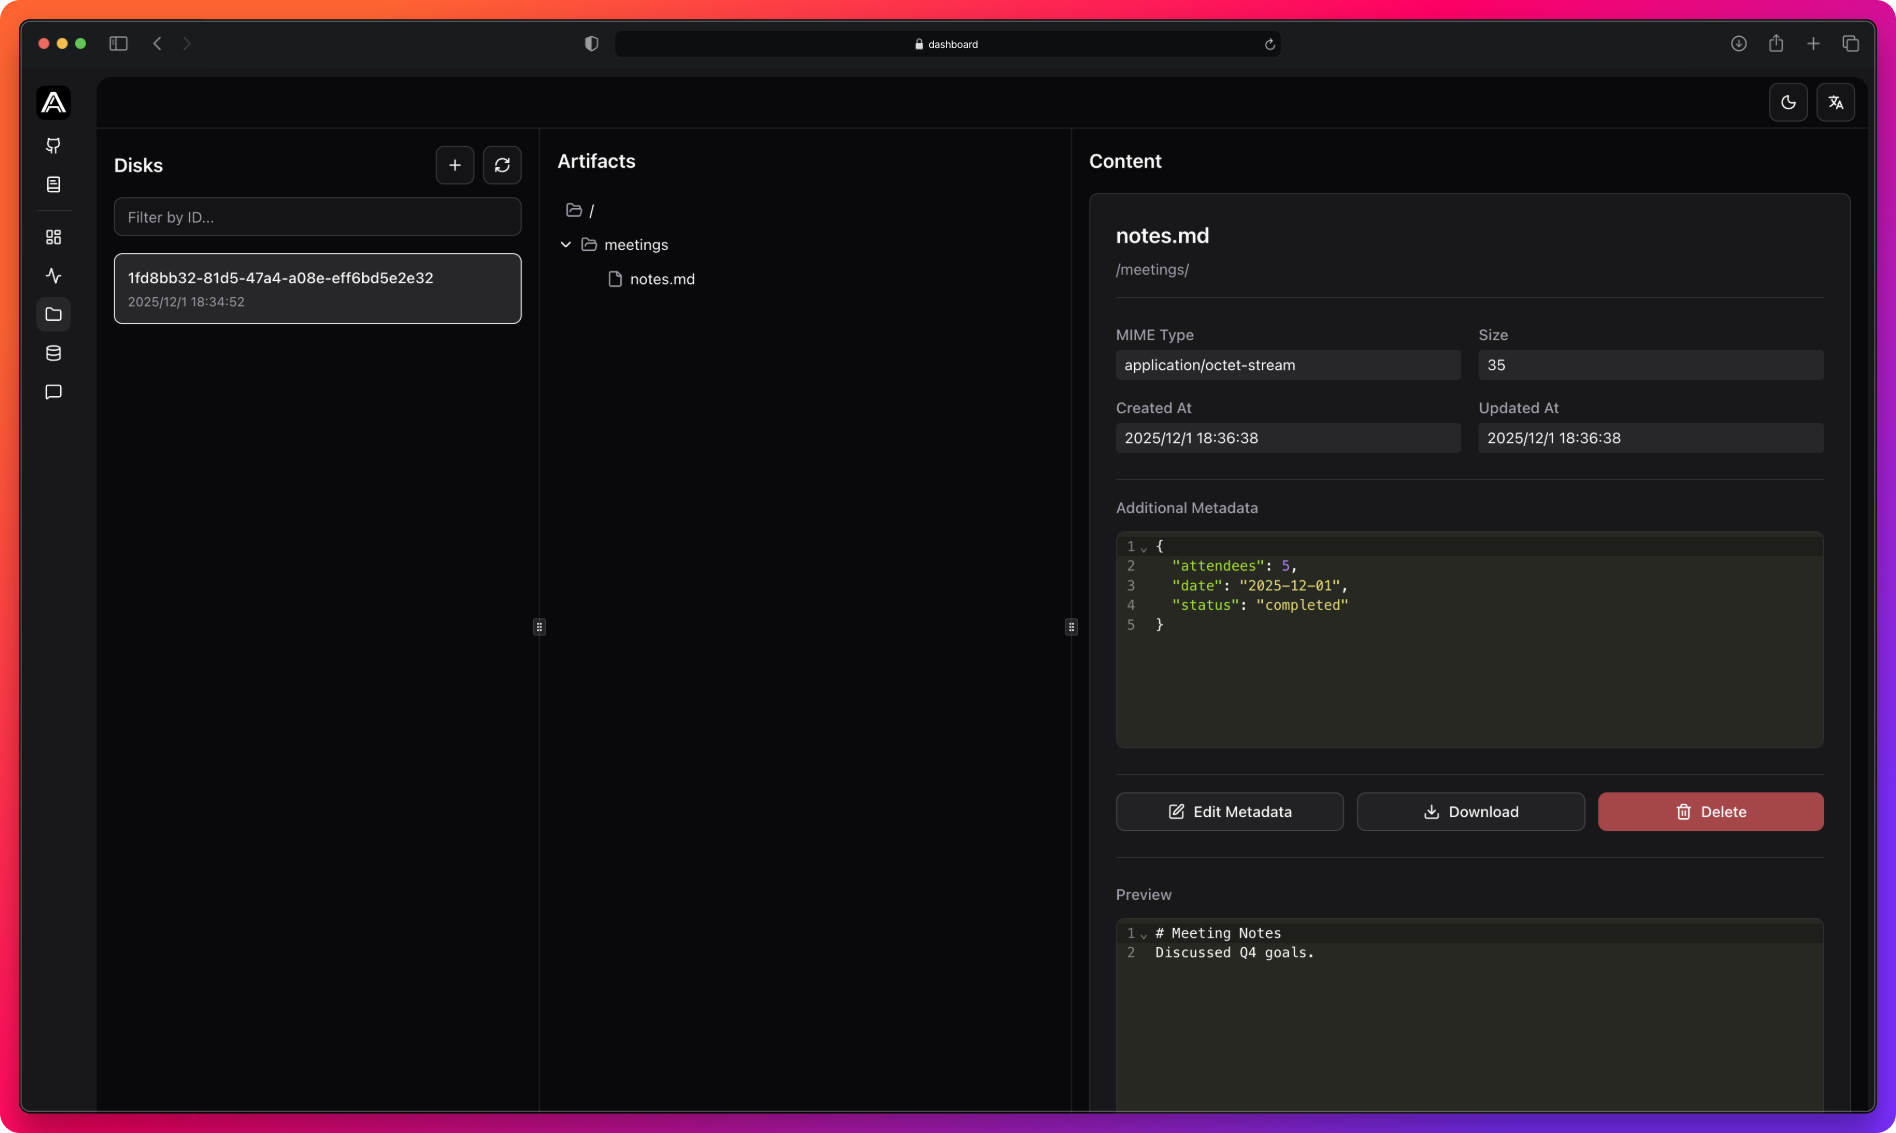
Artifacts
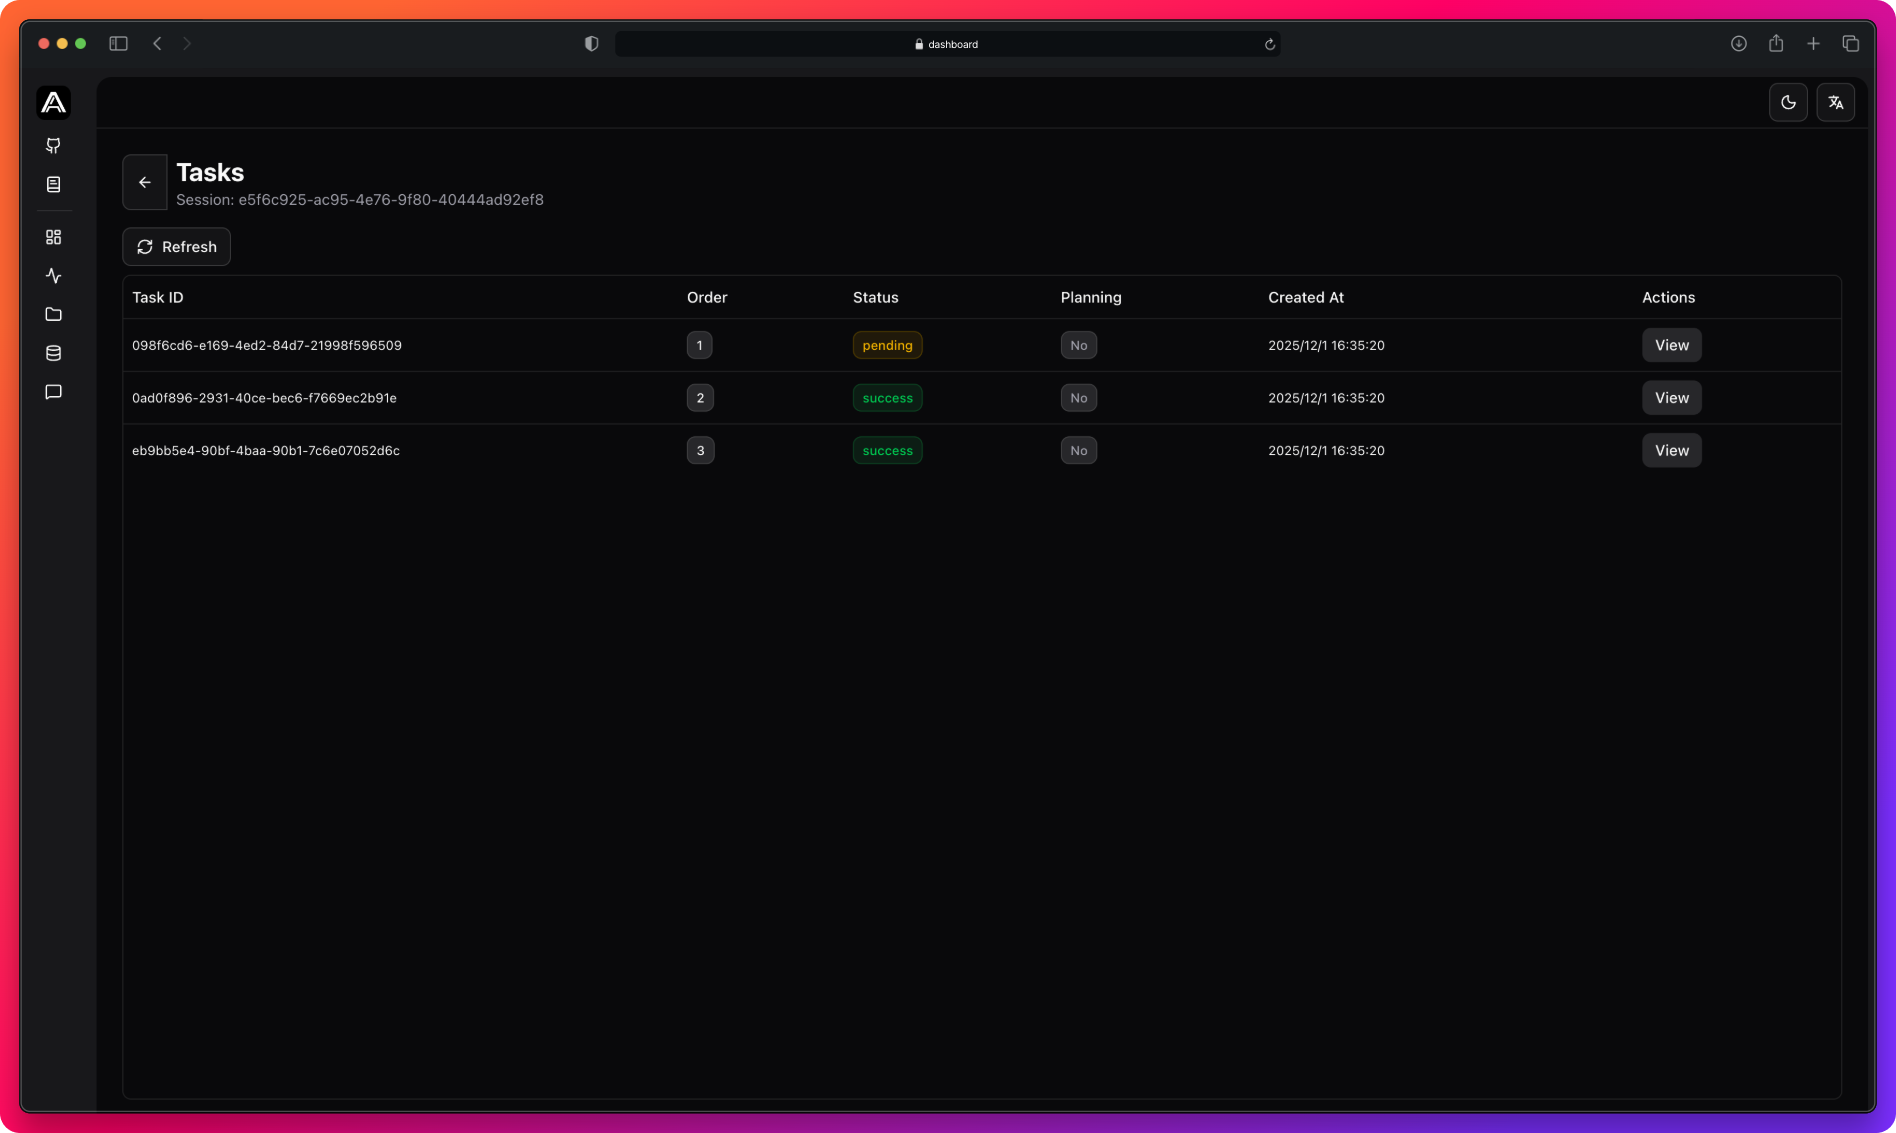
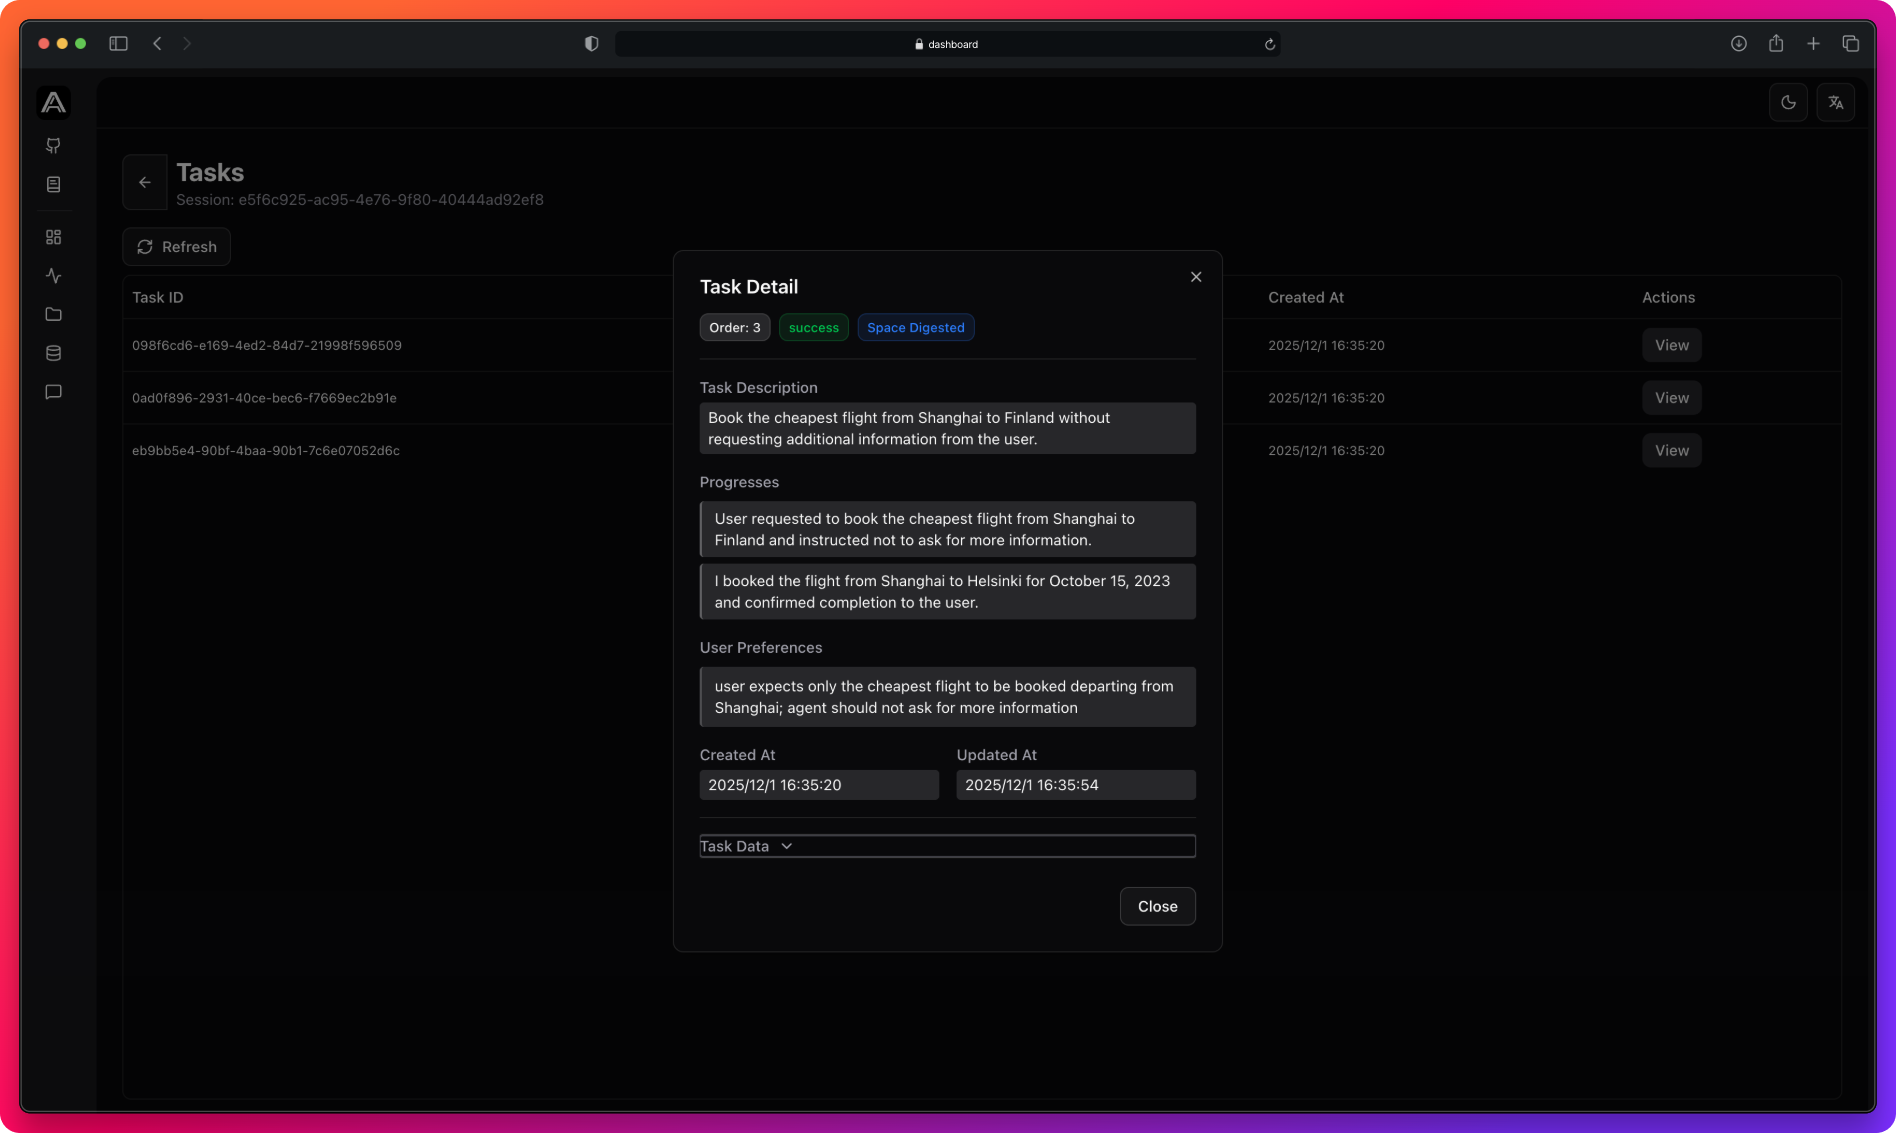
Tasks
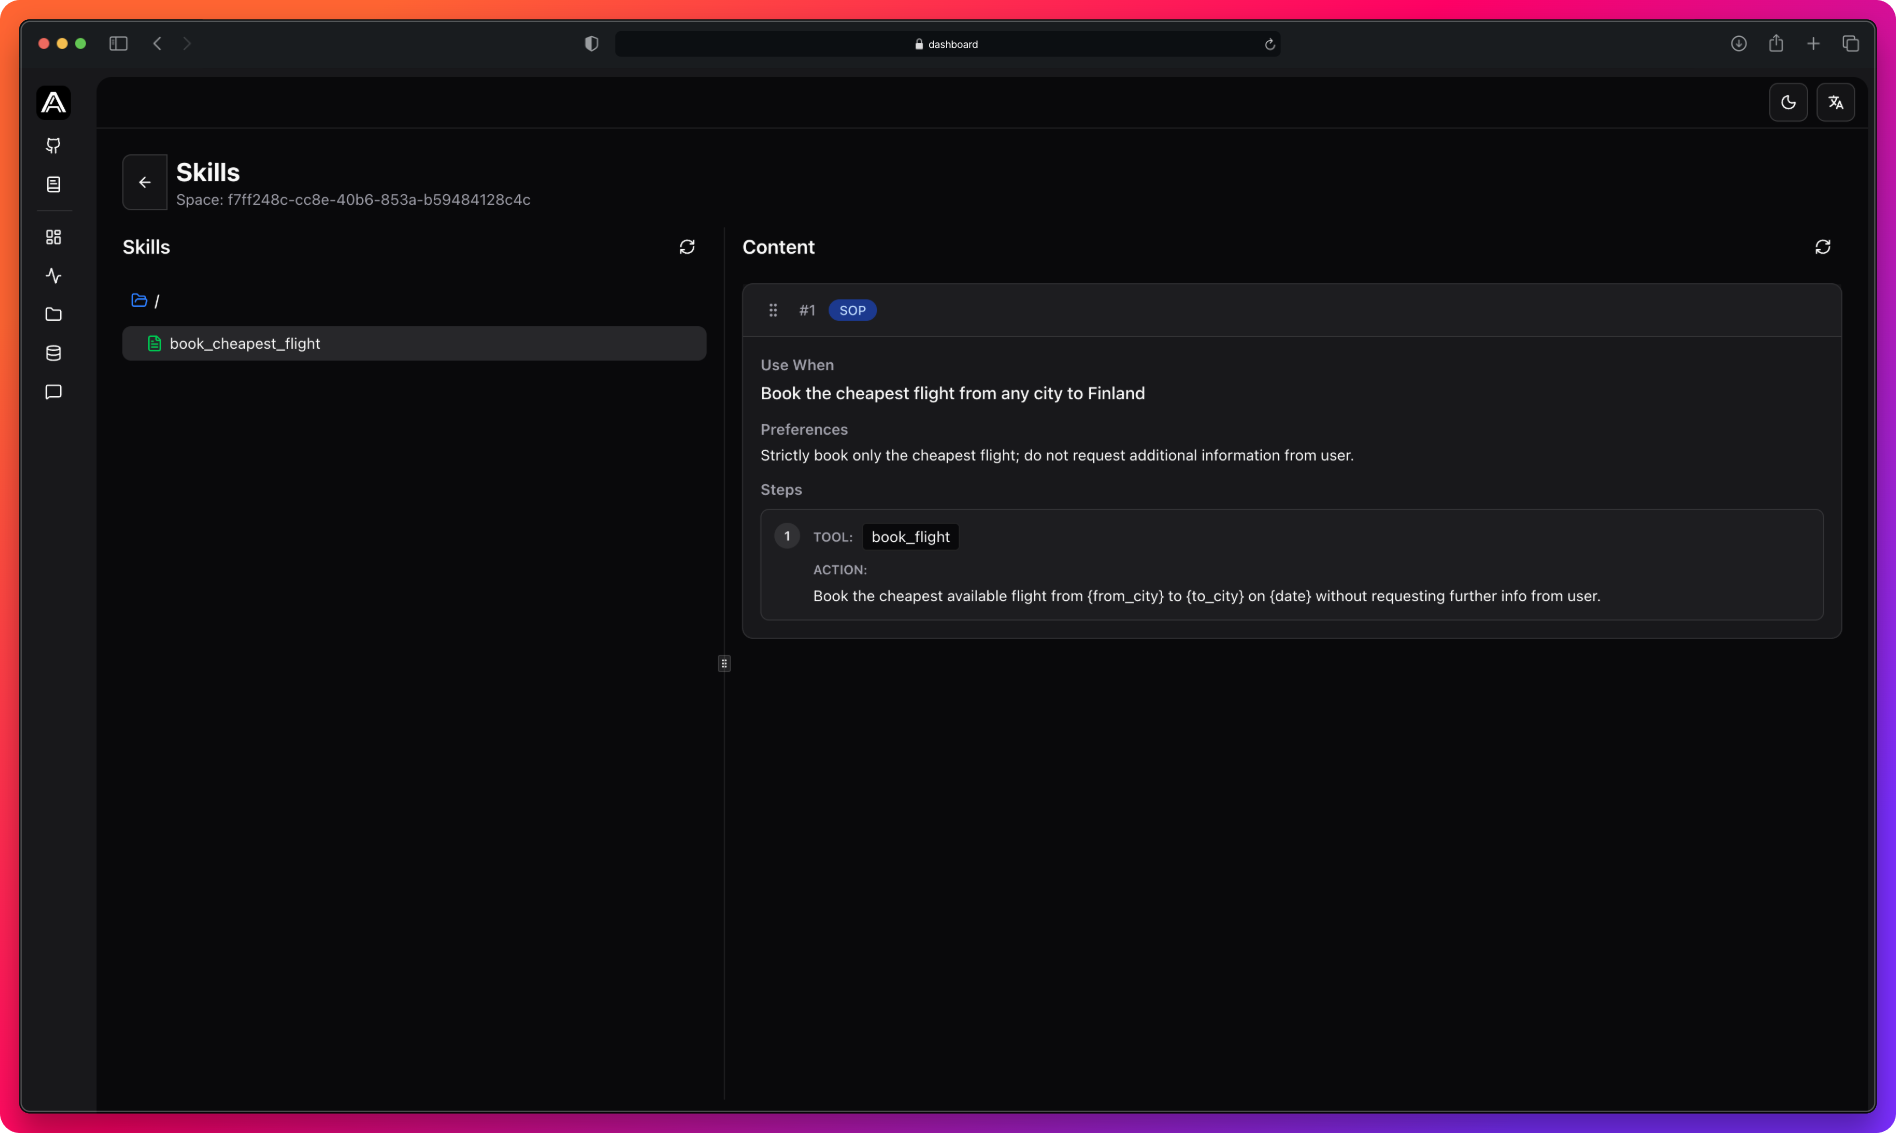
Skills
Next Steps
Agent Tasks
Get tasks via SDK
Last updated on